RESULTS: ULTIMATE TEST

PART 1: VISUAL TESTING
PART 2: THERMAL TESTING
Table Of Contents:
Test 1: Dot Method

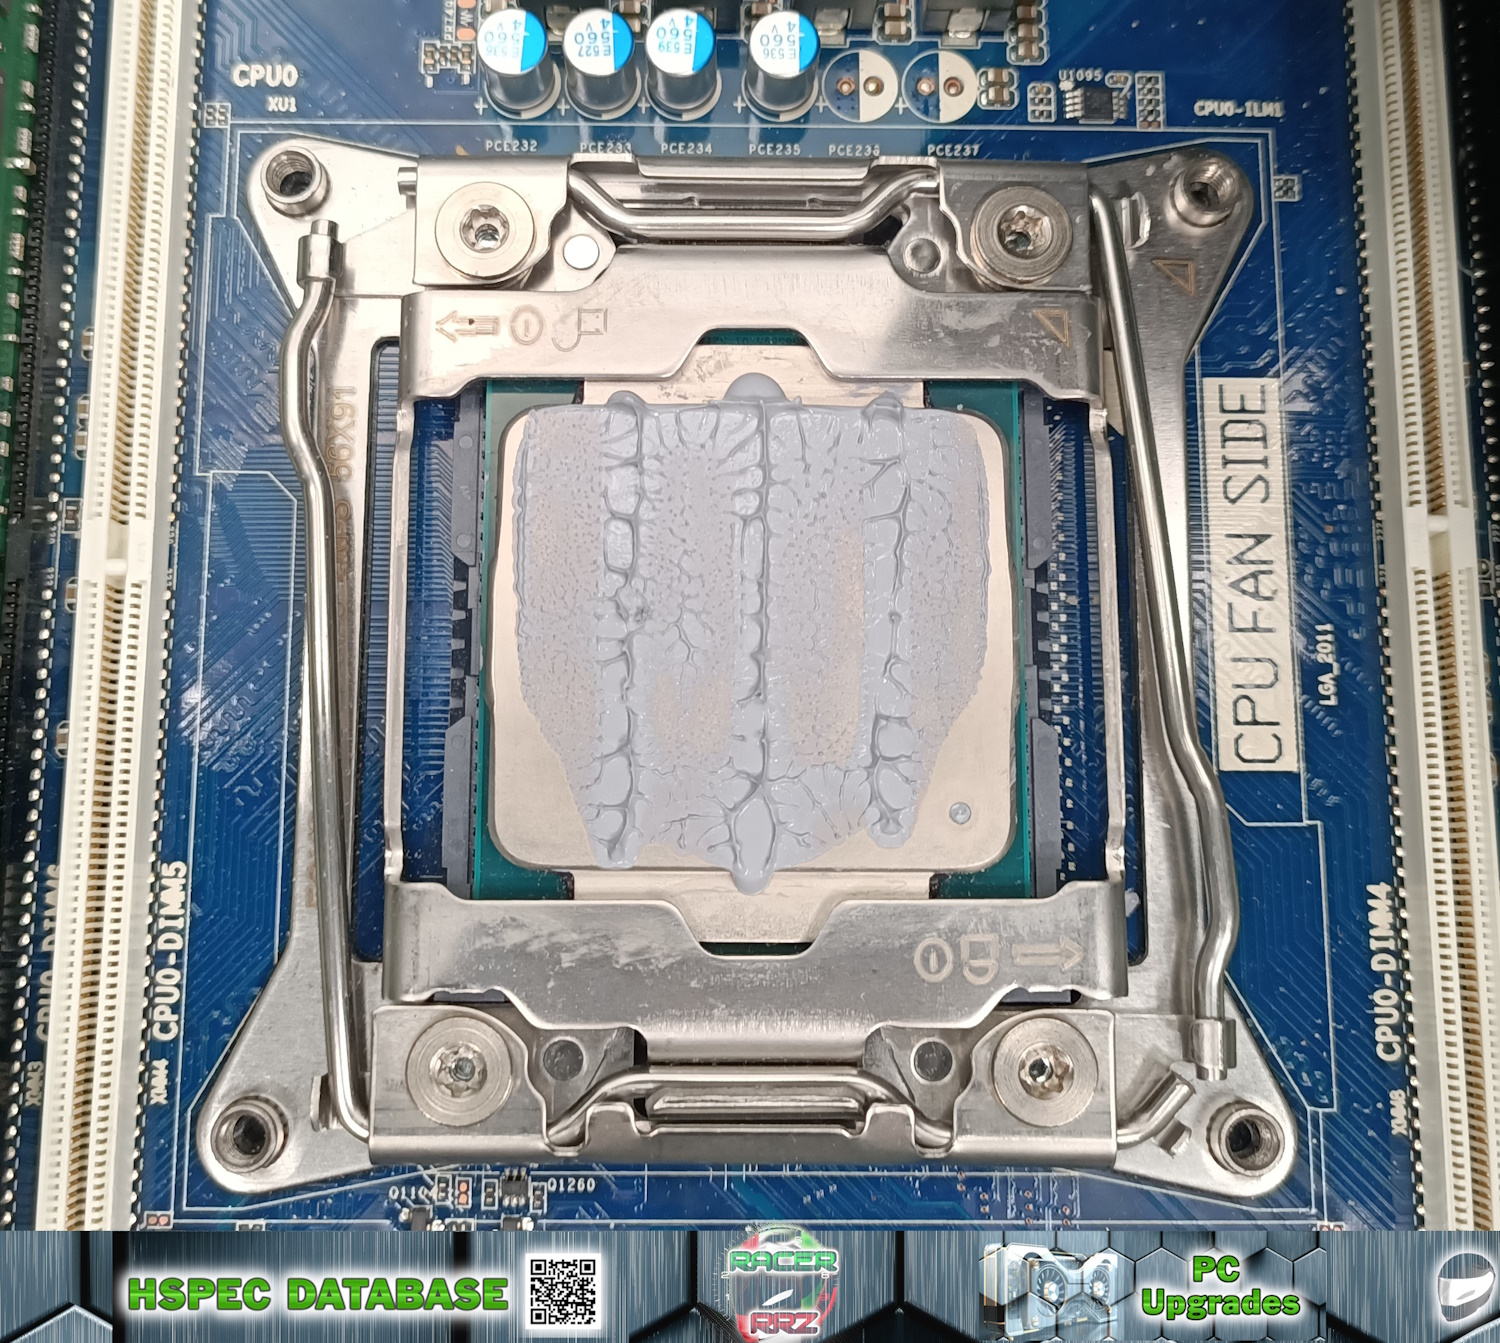
- Application Method: DOT METHOD
- Application Technique: Applied a small central dot ~200µL on the CPU surface.
- Actual Results: Low Effort; Even spread upon mounting; ~82.48% surface area coverage.
- Common Pitfalls: Some paste expelled out upper and lower margins; Sides and lower corners left without paste.
Test 2: Rice Method
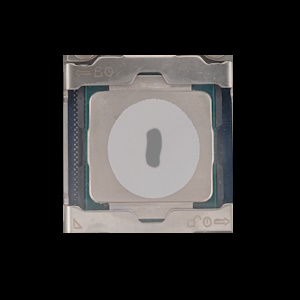
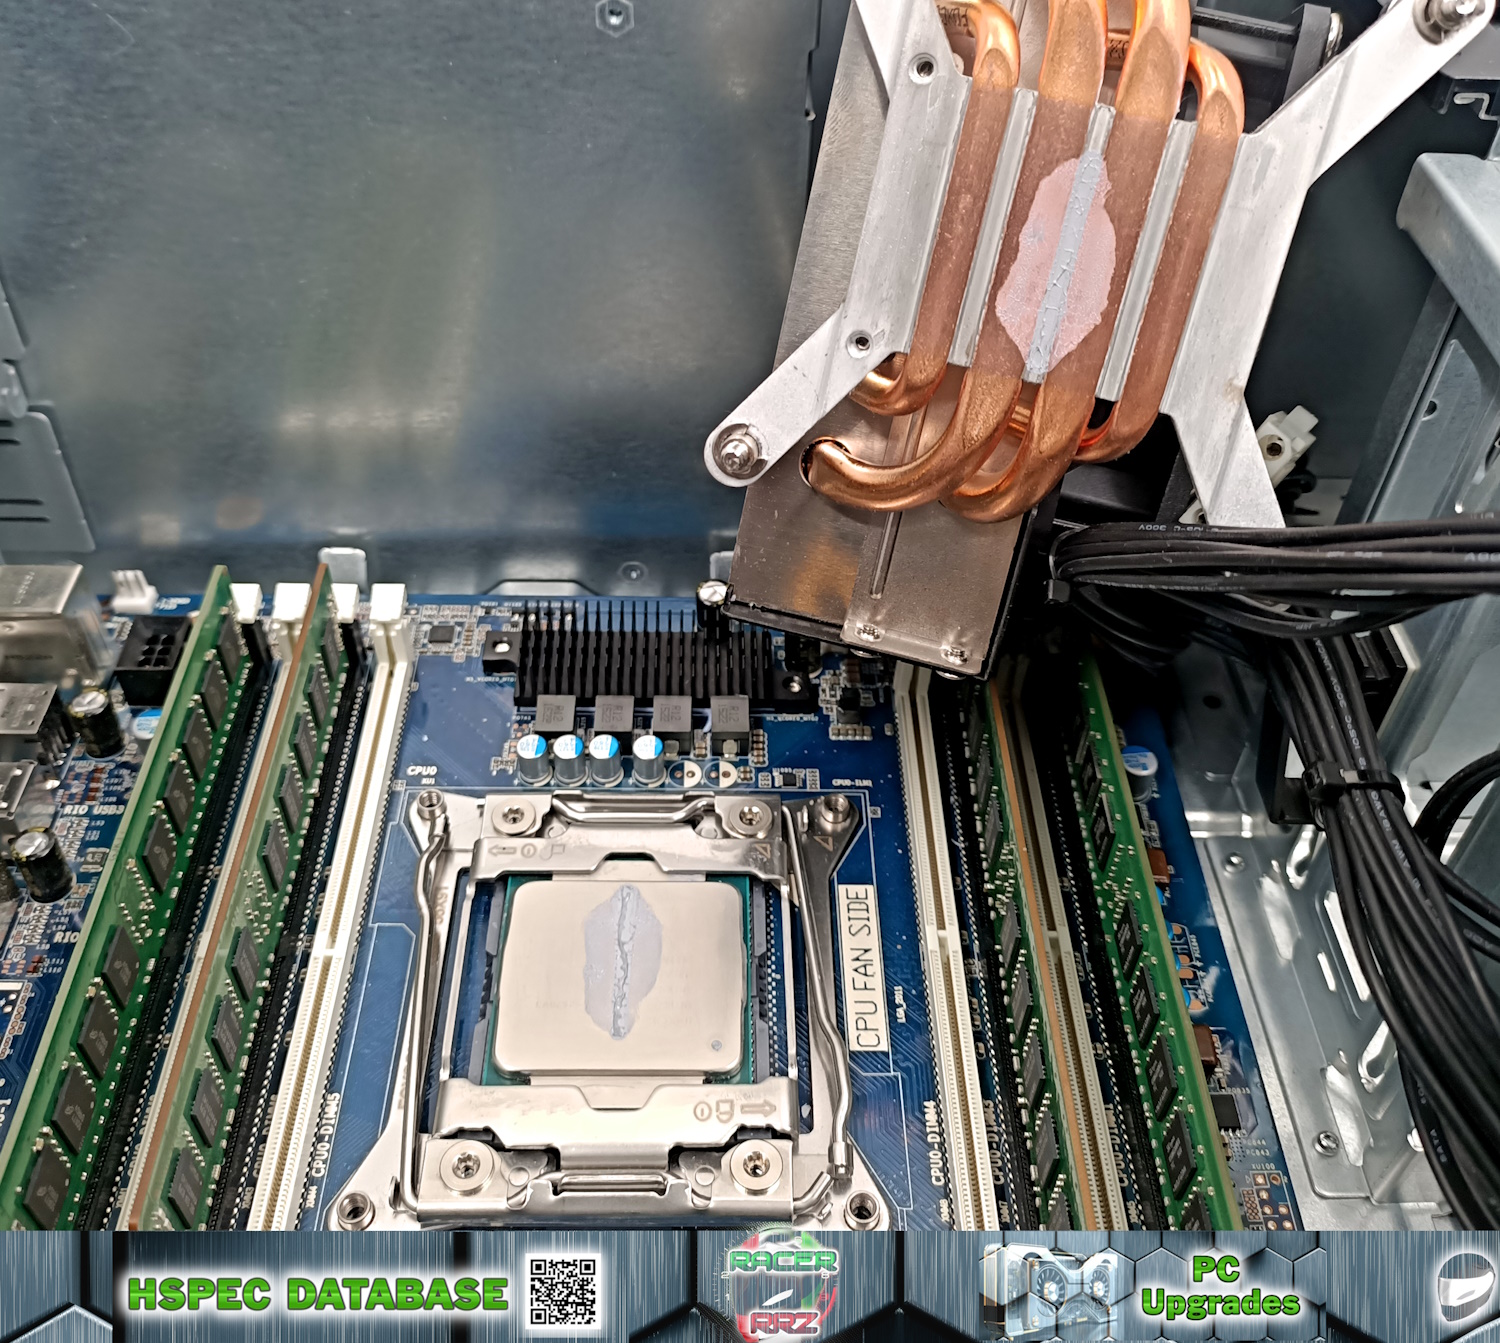
- Application Method: RICE METHOD
- Application Technique: Applied a small central grain of ~200µL of paste on the CPU surface.
- Actual Results: Low Effort; Highly uneven spread upon dismounting; ~20.79% surface area coverage.
- Common Pitfalls: Suspect insufficient paste volume; Likely also limited spread due to cooler imperfections – deep gullies in vertical manner.
Test 3: Three Lines Vertical
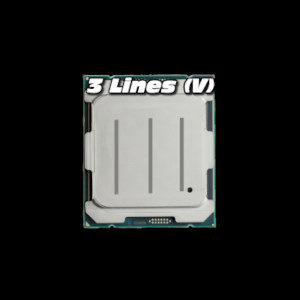
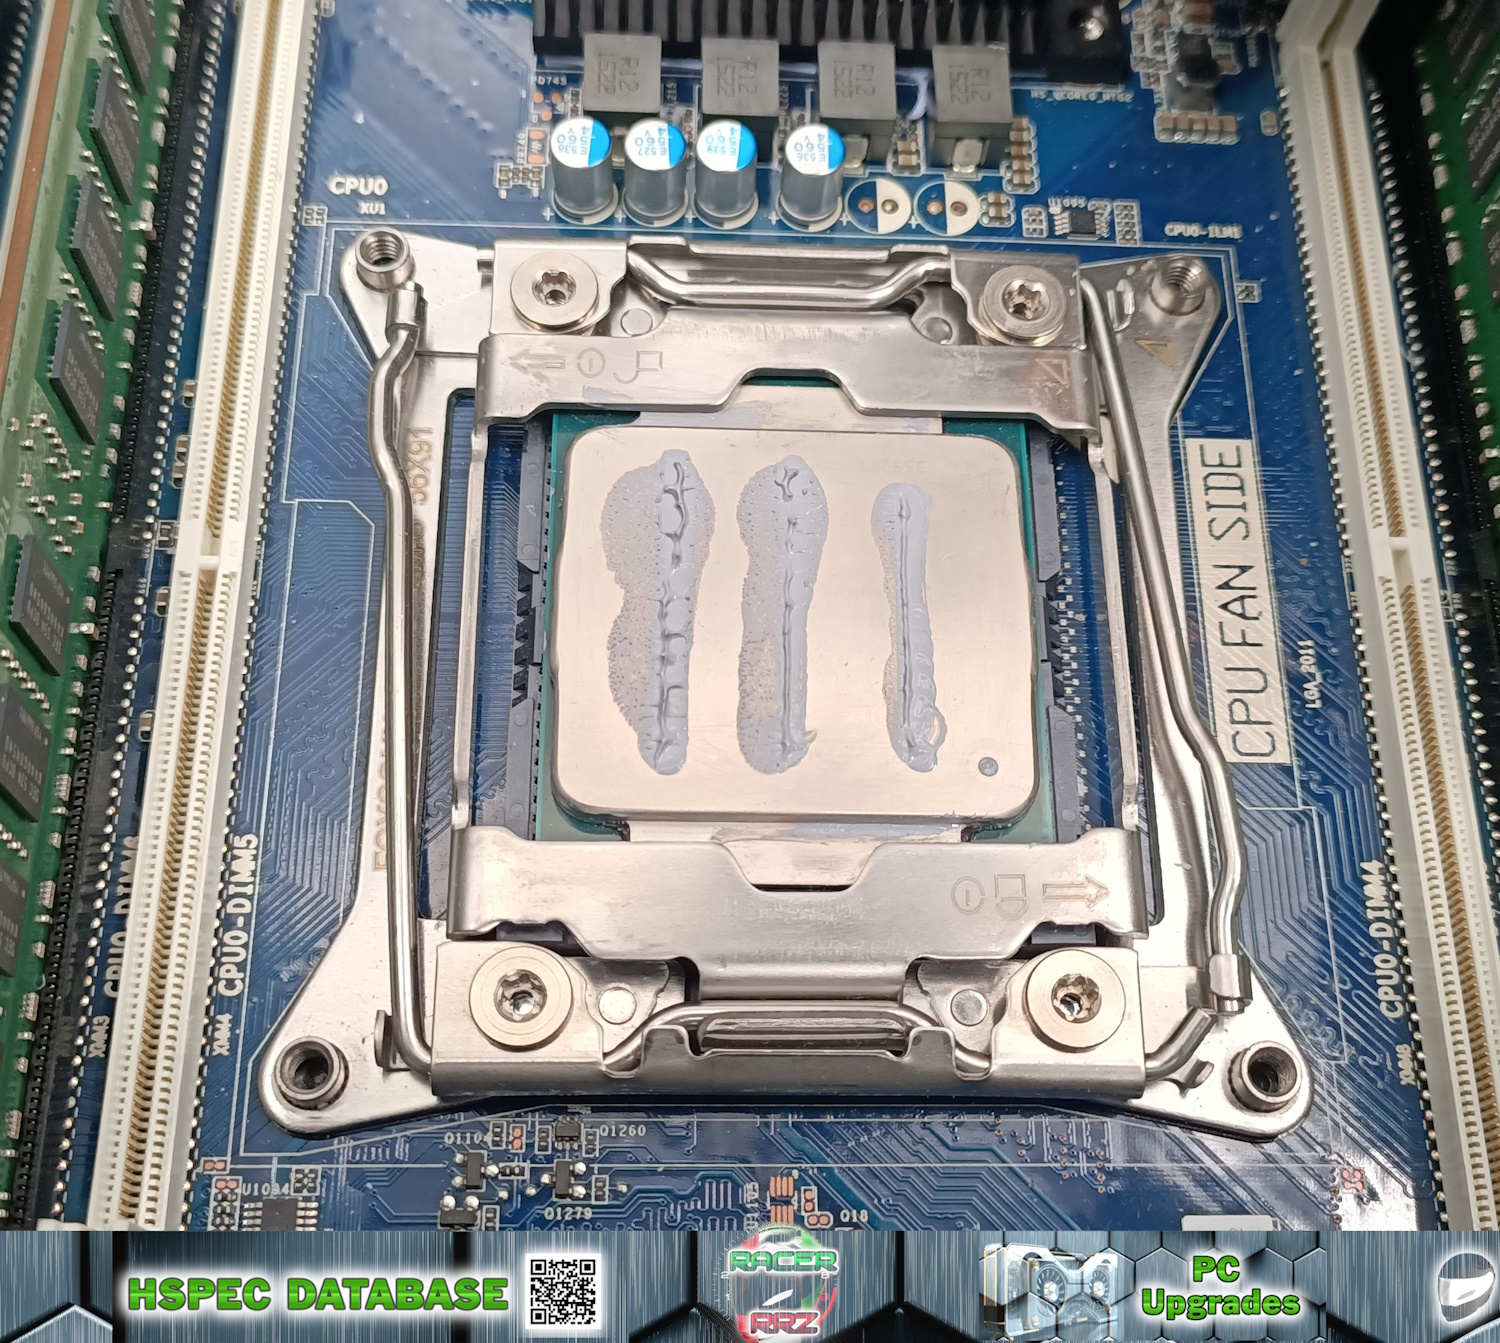
- Application Method: THREE LINES VERTICAL METHOD
- Application Technique: Applied three equal length lines vertically with estimation of ~200µL total on the CPU surface.
- Actual Results: Low Effort; Uneven spread upon dismounting; ~34.88% surface area coverage.
- Common Pitfalls: Very low spread efficiency – likely due to casting imperfections in cooler; May also be insufficient paste volume; Method very inconsistent.
Test 4: Happy Smiley Face Method

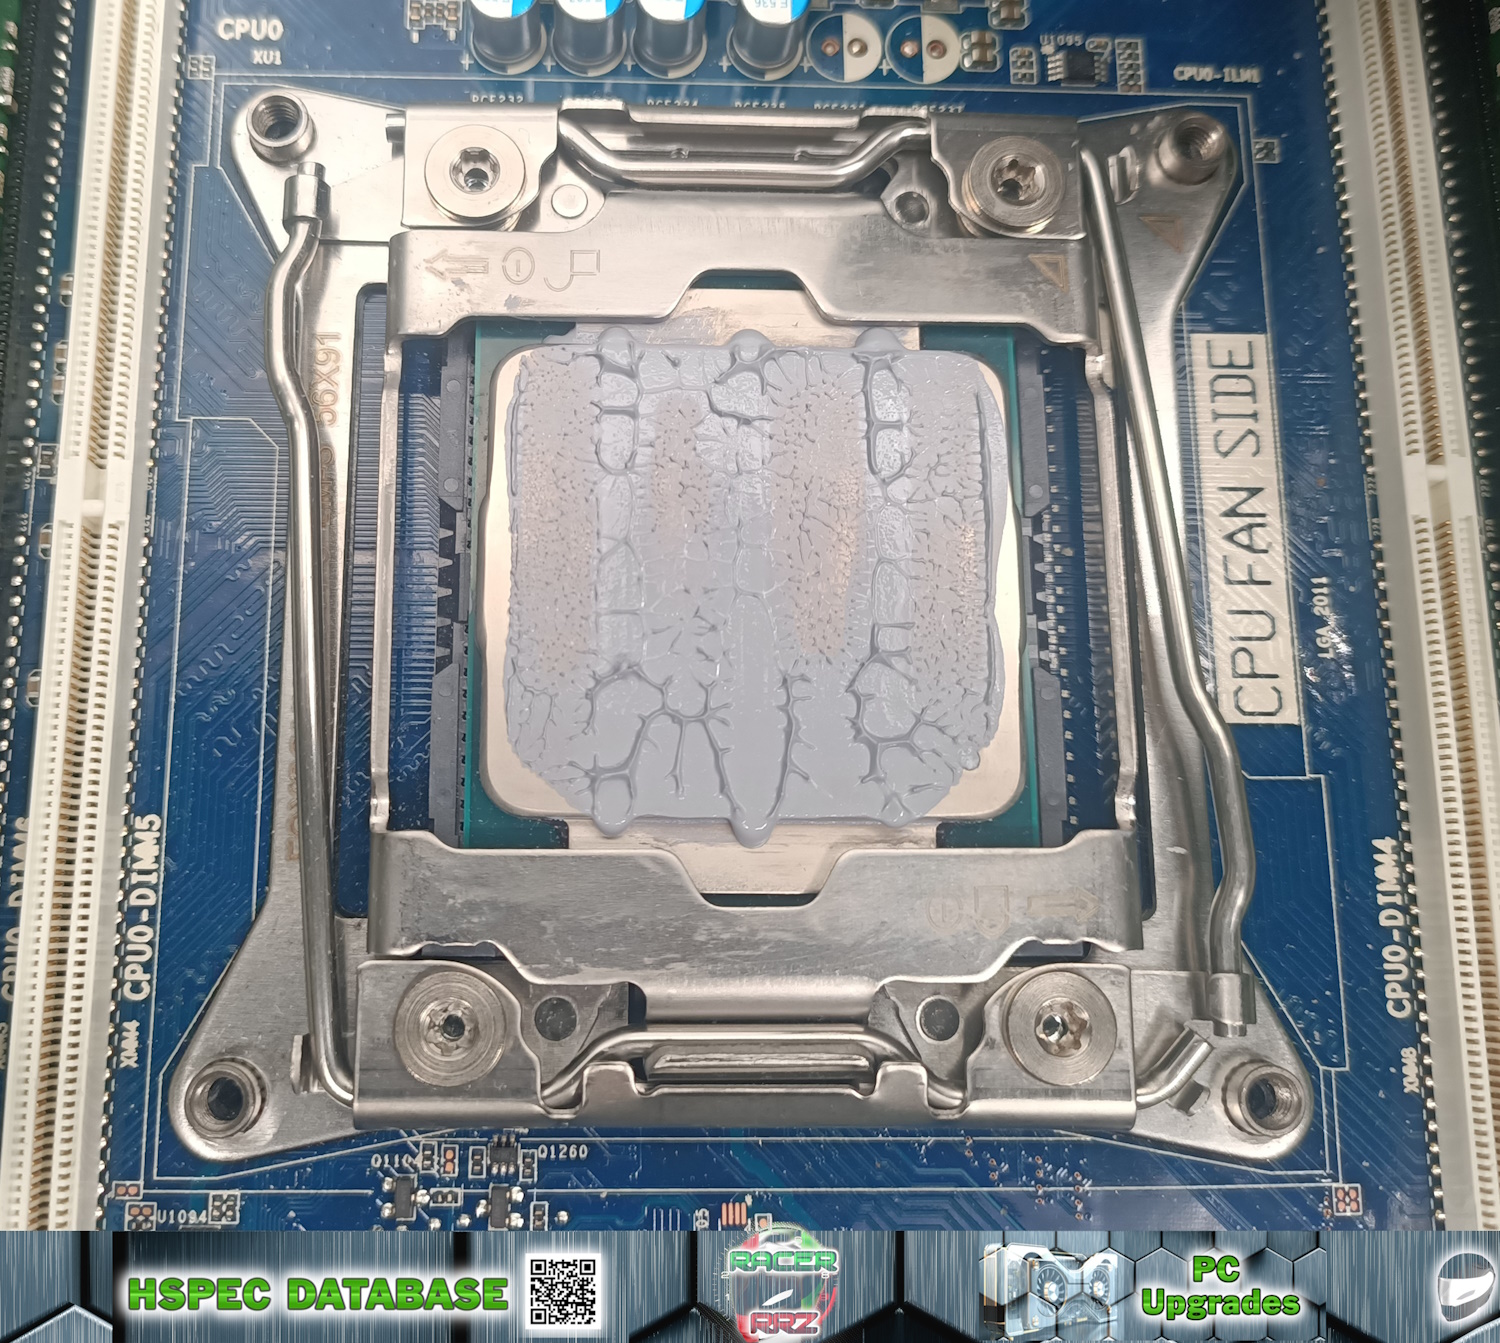
- Application Method: HAPPY SMILEY FACE METHOD
- Application Technique: Applied two equal sized eyes, one large nose and one long smile with estimation of ~200µL total on the CPU surface.
- Actual Results: Medium Effort; Even spread upon dismounting; ~92.11% surface area coverage.
- Common Pitfalls: Excellent spread efficiency; Some paste spillover at upper and lower regions, and some uncovered IHS at left and right margins.
Test 5: Square with Dot Method

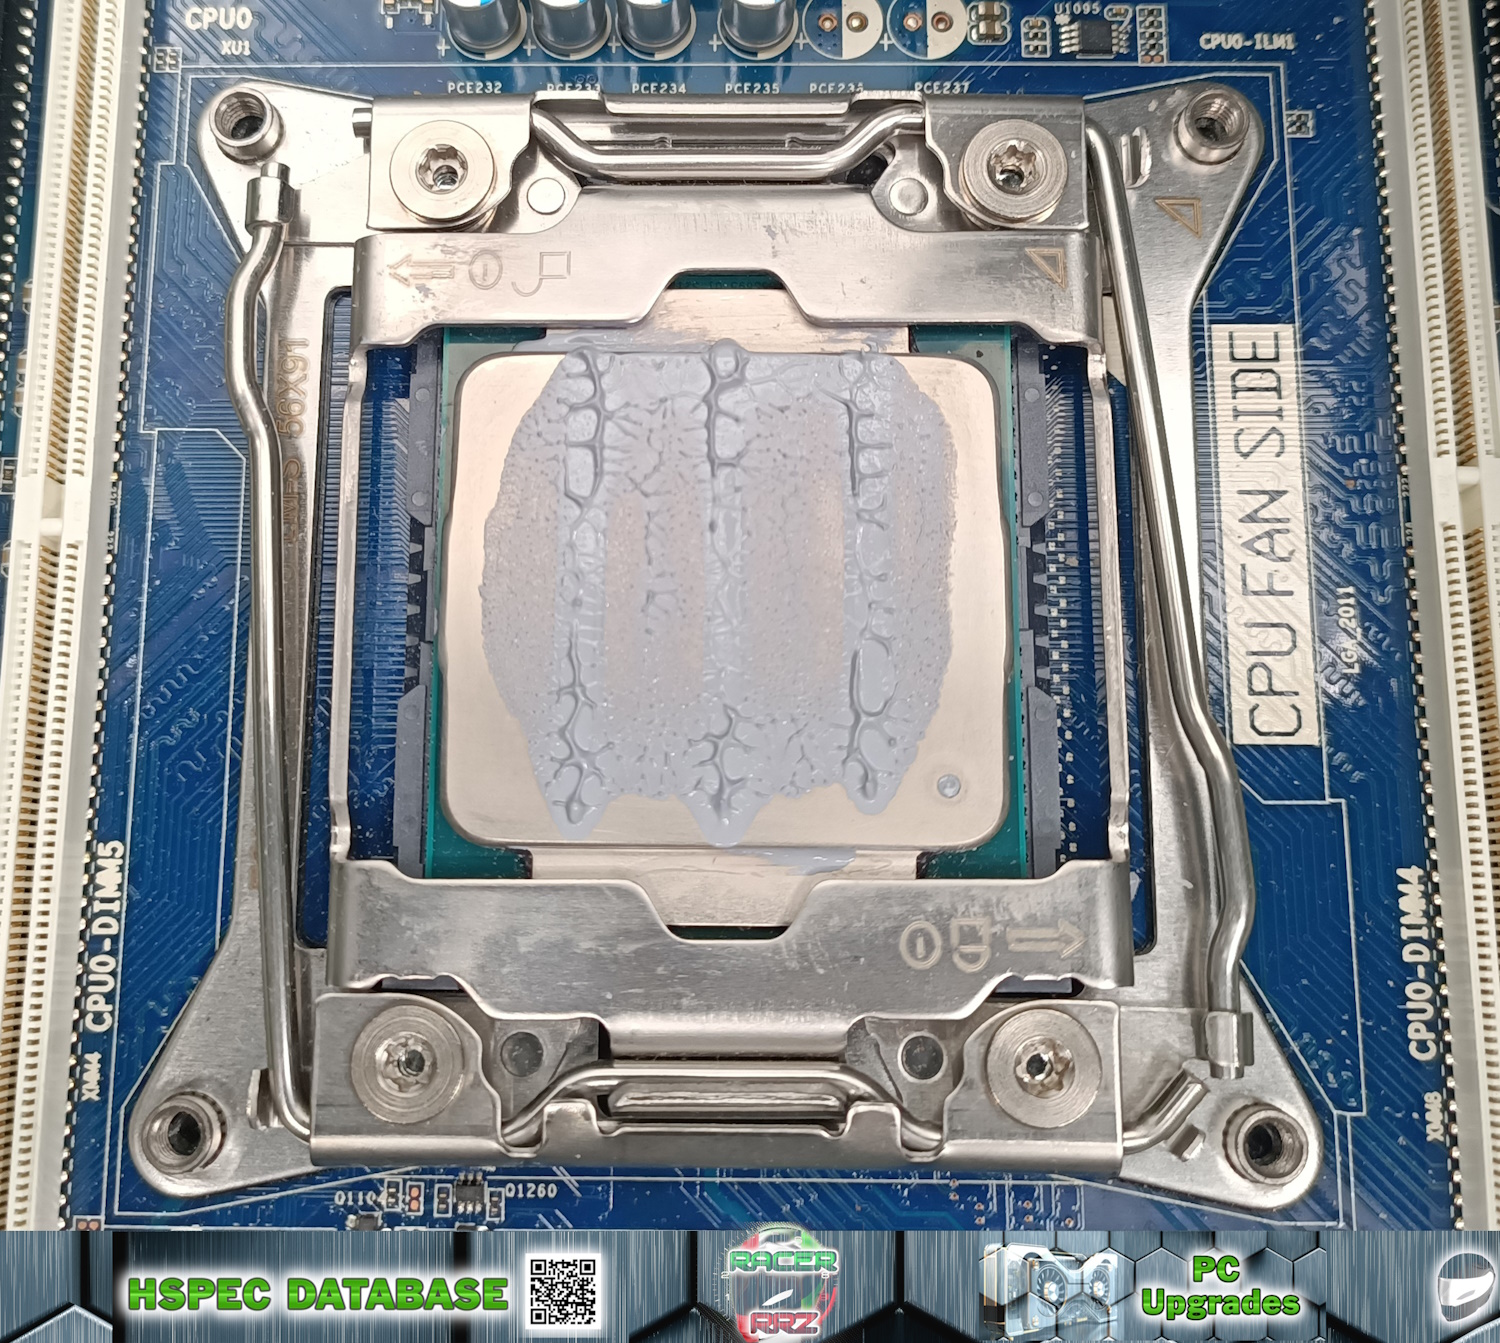
- Application Method: SQUARE WITH DOT METHOD
- Application Technique: Large square applied with a large dot in the middle; with estimation of ~200µL total on the CPU surface.
- Actual Results: Medium Effort; Even spread upon dismounting; ~72.67% surface area coverage.
- Common Pitfalls: Good spread efficiency; Slight paste spillover at upper regions, and some uncovered IHS at left, bottom and right margins.
Test 6: LETTER Z Method
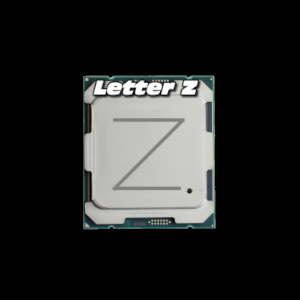
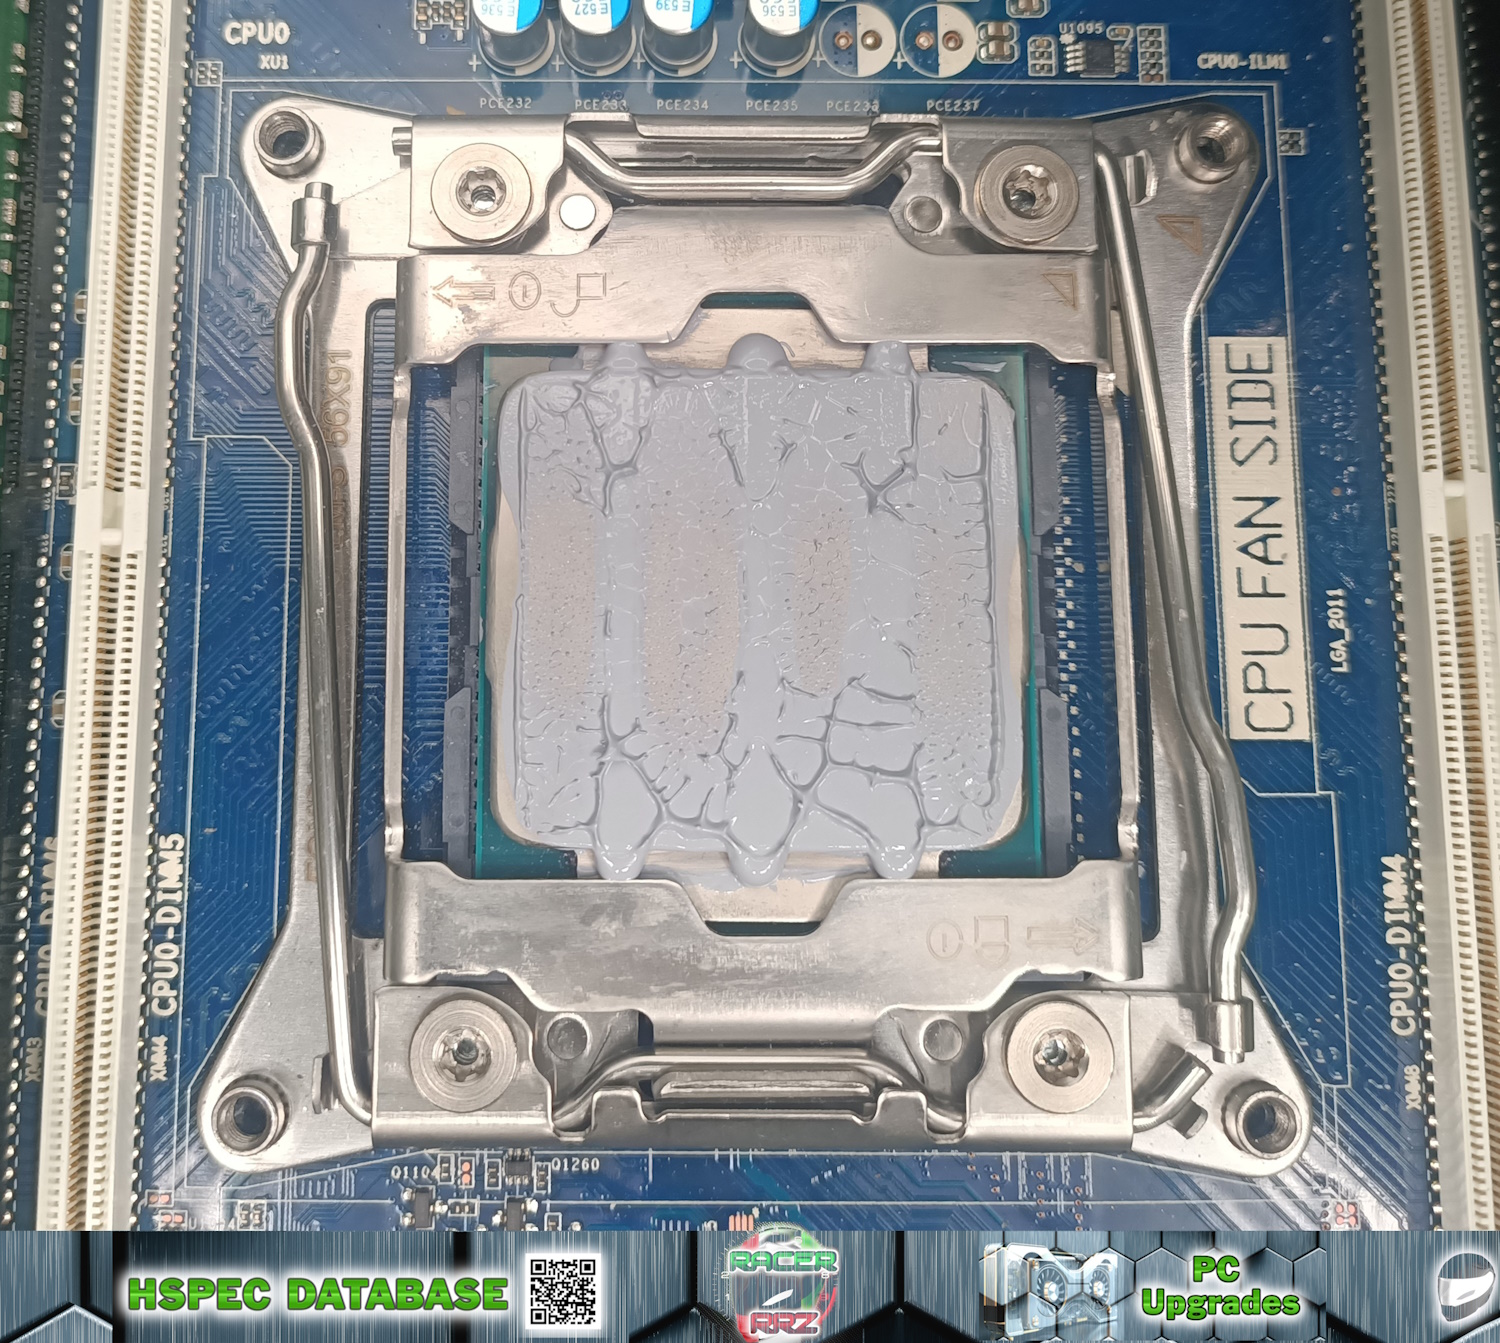
- Application Method: LETTER Z METHOD
- Application Technique: Large bead applied in shape of a letter Z; with estimation of ~250µL total on the CPU surface.
- Actual Results: Medium Effort; Even spread upon dismounting; ~97.91% surface area coverage.
- Common Pitfalls: Good spread efficiency; Huge paste spillover at upper and lower regions; too much paste added for IHS surface.
Test 7: SPREADER WITH SMILEY Method

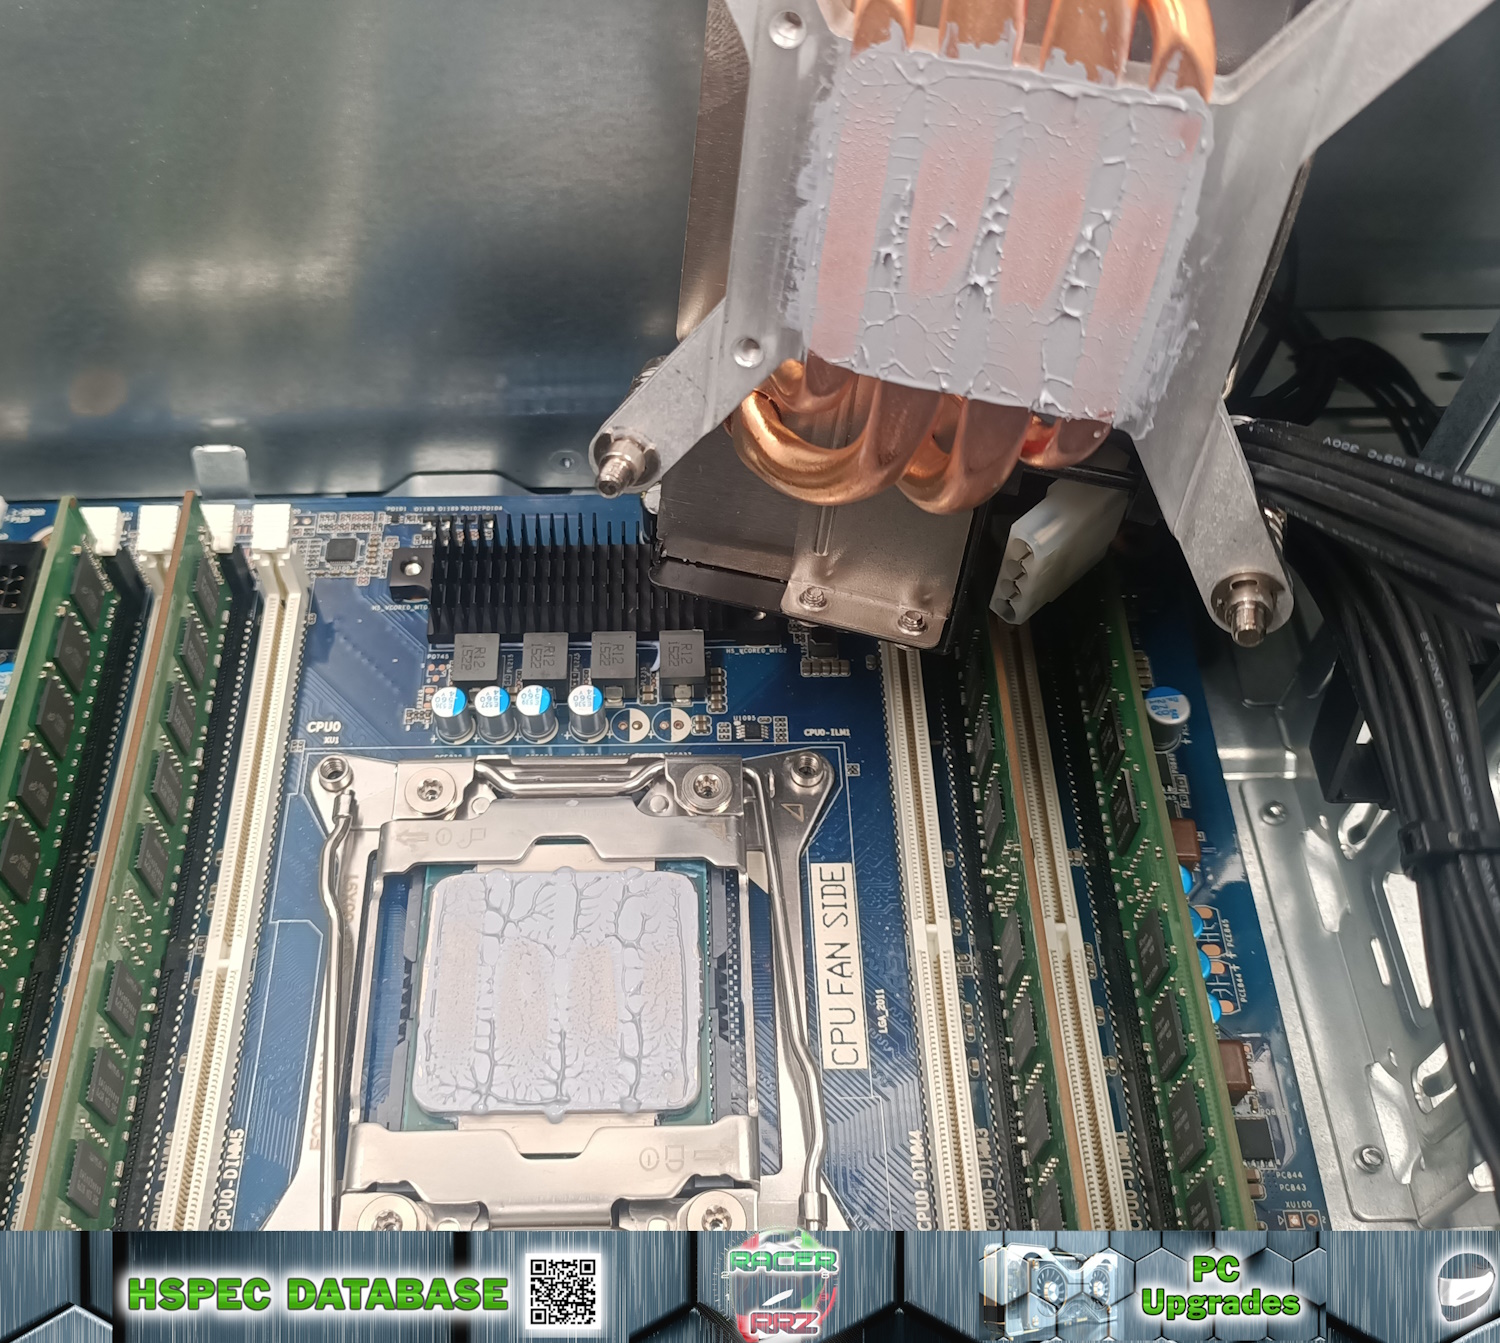
- Application Method: SPREADER WITH SMILEY METHOD
- Application Technique: RACERRRZ’s Signature method. Apply blob in middle, spread for even full IHS coverage, add two large blobs for eyes, one large blob for nose and a long smile, also add small blob to cooler surface and spread for thin coverage; with estimation of ~220µL total on the CPU surface.
- Actual Results: High Effort; Even full spread upon dismounting; ~98.03% surface area coverage.
- Common Pitfalls: Good spread efficiency; Some paste spillover at upper and lower regions; Coverage appears adequate for IHS surface.
Data Graphs:
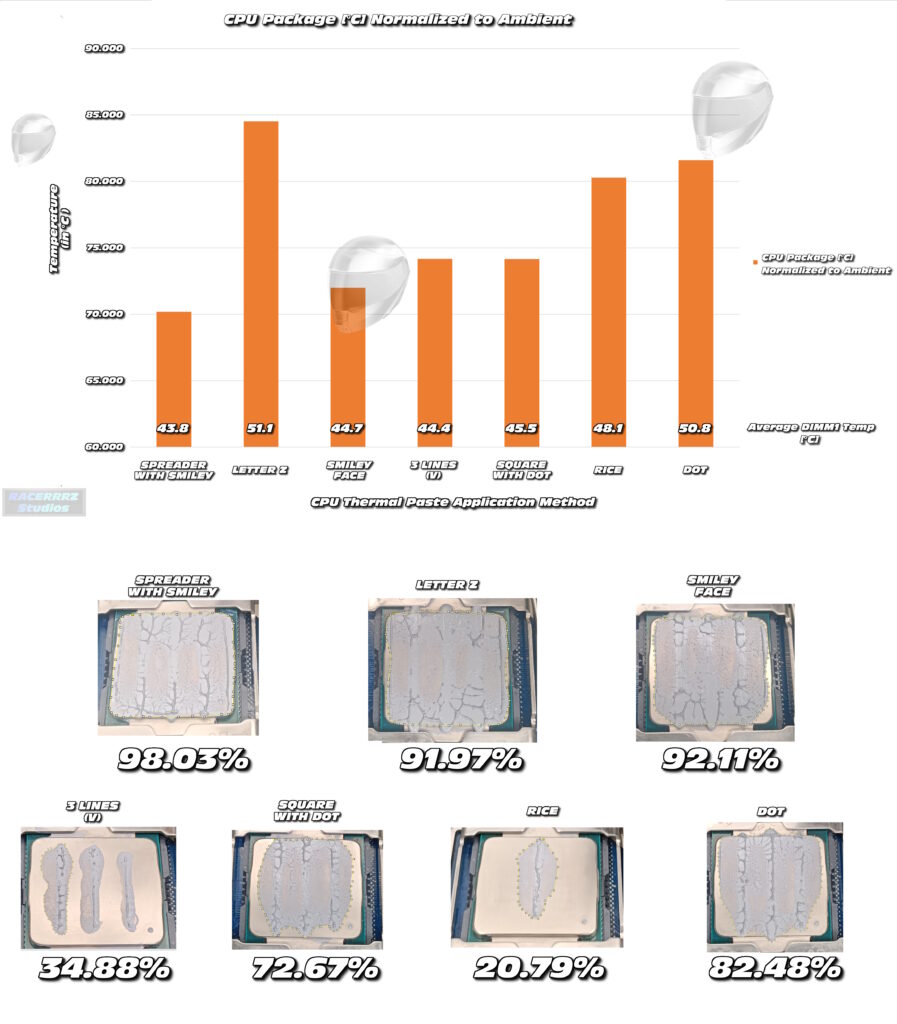
Thermal Testing Results:
Top 3 Methods (in order of best to worst):
Spreader With Smiley : Happy Smiley : Square With Dot
Worst 3 Methods (in order of best to worst):
RICE Method : DOT Method : Letter Z Method
Results and Caveats:
Three Line method and Rice method were super inconsistent. Tests were done back to back with ~10min cool-down between runs. Test order was: RICE -> DOT -> Square with Dot -> Three Lines -> Smiley Face -> Letter Z -> Spreader with Smiley. Paste volumes were scaled to an estimate of ~200µL for each condition. The Z440’s cooler does have casting imperfections running in vertical directions which may have prevented good dispersion of paste for methods with a vertical application style. A machined smooth CPU cooler surface may yield a better outcome for them (the HP Z440’s Z Cooler has such a smooth surface).
All results are n = 1; with only one trial having been done. Ideally this process would be repeated twice more to get three independent experiments for pooling and statistical analysis. Better volume estimation would also improve the detection of differences. The data suggested that low or high thermal paste volumes may cause elevated CPU package temperatures. The RICE method only had 20.79% IHS coverage, and Spreader with Smiley had 98% IHS coverage, and yet the un-normalized data reported similar low CPU temperatures. This either suggests that thermal paste has no impact on IHS to cooler cooling efficiency (i.e. we don’t need thermal paste or the thermal paste I was using was so bad it did nothing for cooling efficiency), or that just relying on CPU temperature is insufficient to draw valid conclusions.
Normalization Process: Unfortunately no ambient temperature or motherboard sensor temperatures were logged during the run (I was expecting HWiNFO to log something, but nope!).
My best deduction was to use RAM module average temperatures during a CineBench R23 run to serve as a novel “normalization factor”. Naturally it’s not perfect and it assumes that RAM module temperatures will be consistent between tests. Sure enough the DIMM temperatures were different between conditions, with Spreader with Smiley, Smiley, and Square with Dot yielding the lowest average RAM temperatures, and Rice method, Letter Z and Dot Method yielding the highest average RAM temperatures. Although not conventional, I decided to see what impact it would have to normalize the CPU Package Temperatures relative to DIMM Module 1’s average temperature as my closest compensation for a lack of “ambient temperature” normalization.
The graph has the average DIMM1 temperatures displayed. All DIMM 1 temperature data was normalized relative to smiley face DIMM 1 temperature data, then that scaling factor (%) was inversed according to the formula: 1/norm * 100% to net a decimal factor that could scale the CPU package temperatures according to smiley face DIMM1 temperatures. This result had minimal impact on methods that presented similar RAM temperatures but penalized methods that had elevated RAM temperatures (which might not be a fair indicator of changes in ambient temperature impact as such, but still interesting on its own accord). If RAM temperatures were substantially elevated, it’s either from higher ambient (all tests done back to back in a large living room) or from CPU heat radiation via convection. The best thermal paste method should leave the whole system running cooler, if it were truly the best – or at least that was my rationale behind this unorthodox normalization process.
For additional comparison, the table below has the data with the average temperature of all 4 DIMM modules, plus normalization relative to Smiley, relative to the average of all four DIMMs. Regardless of the processing method, Spreader with Smiley and Smiley remained the best methods, with the lowest CPU package temperatures before and after normalization as well as the lowest average DIMM temperatures.
| Application Method | CPU Package Temp (°C) | Normalized CPU Temp (°C) | DIMM Average Temp (°C) |
| Spreader | 71.63 | 70.61 | 43.60 |
| Letter Z | 73.84 | 83.82 | 50.21 |
| Smiley | 72.00 | 72.00 | 44.23 |
| 3 Lines V | 74.63 | 78.16 | 46.32 |
| Square with Dot | 72.72 | 77.68 | 47.24 |
| DOT | 74.53 | 80.91 | 48.01 |
| RICE | 71.76 | 84.22 | 51.91 |
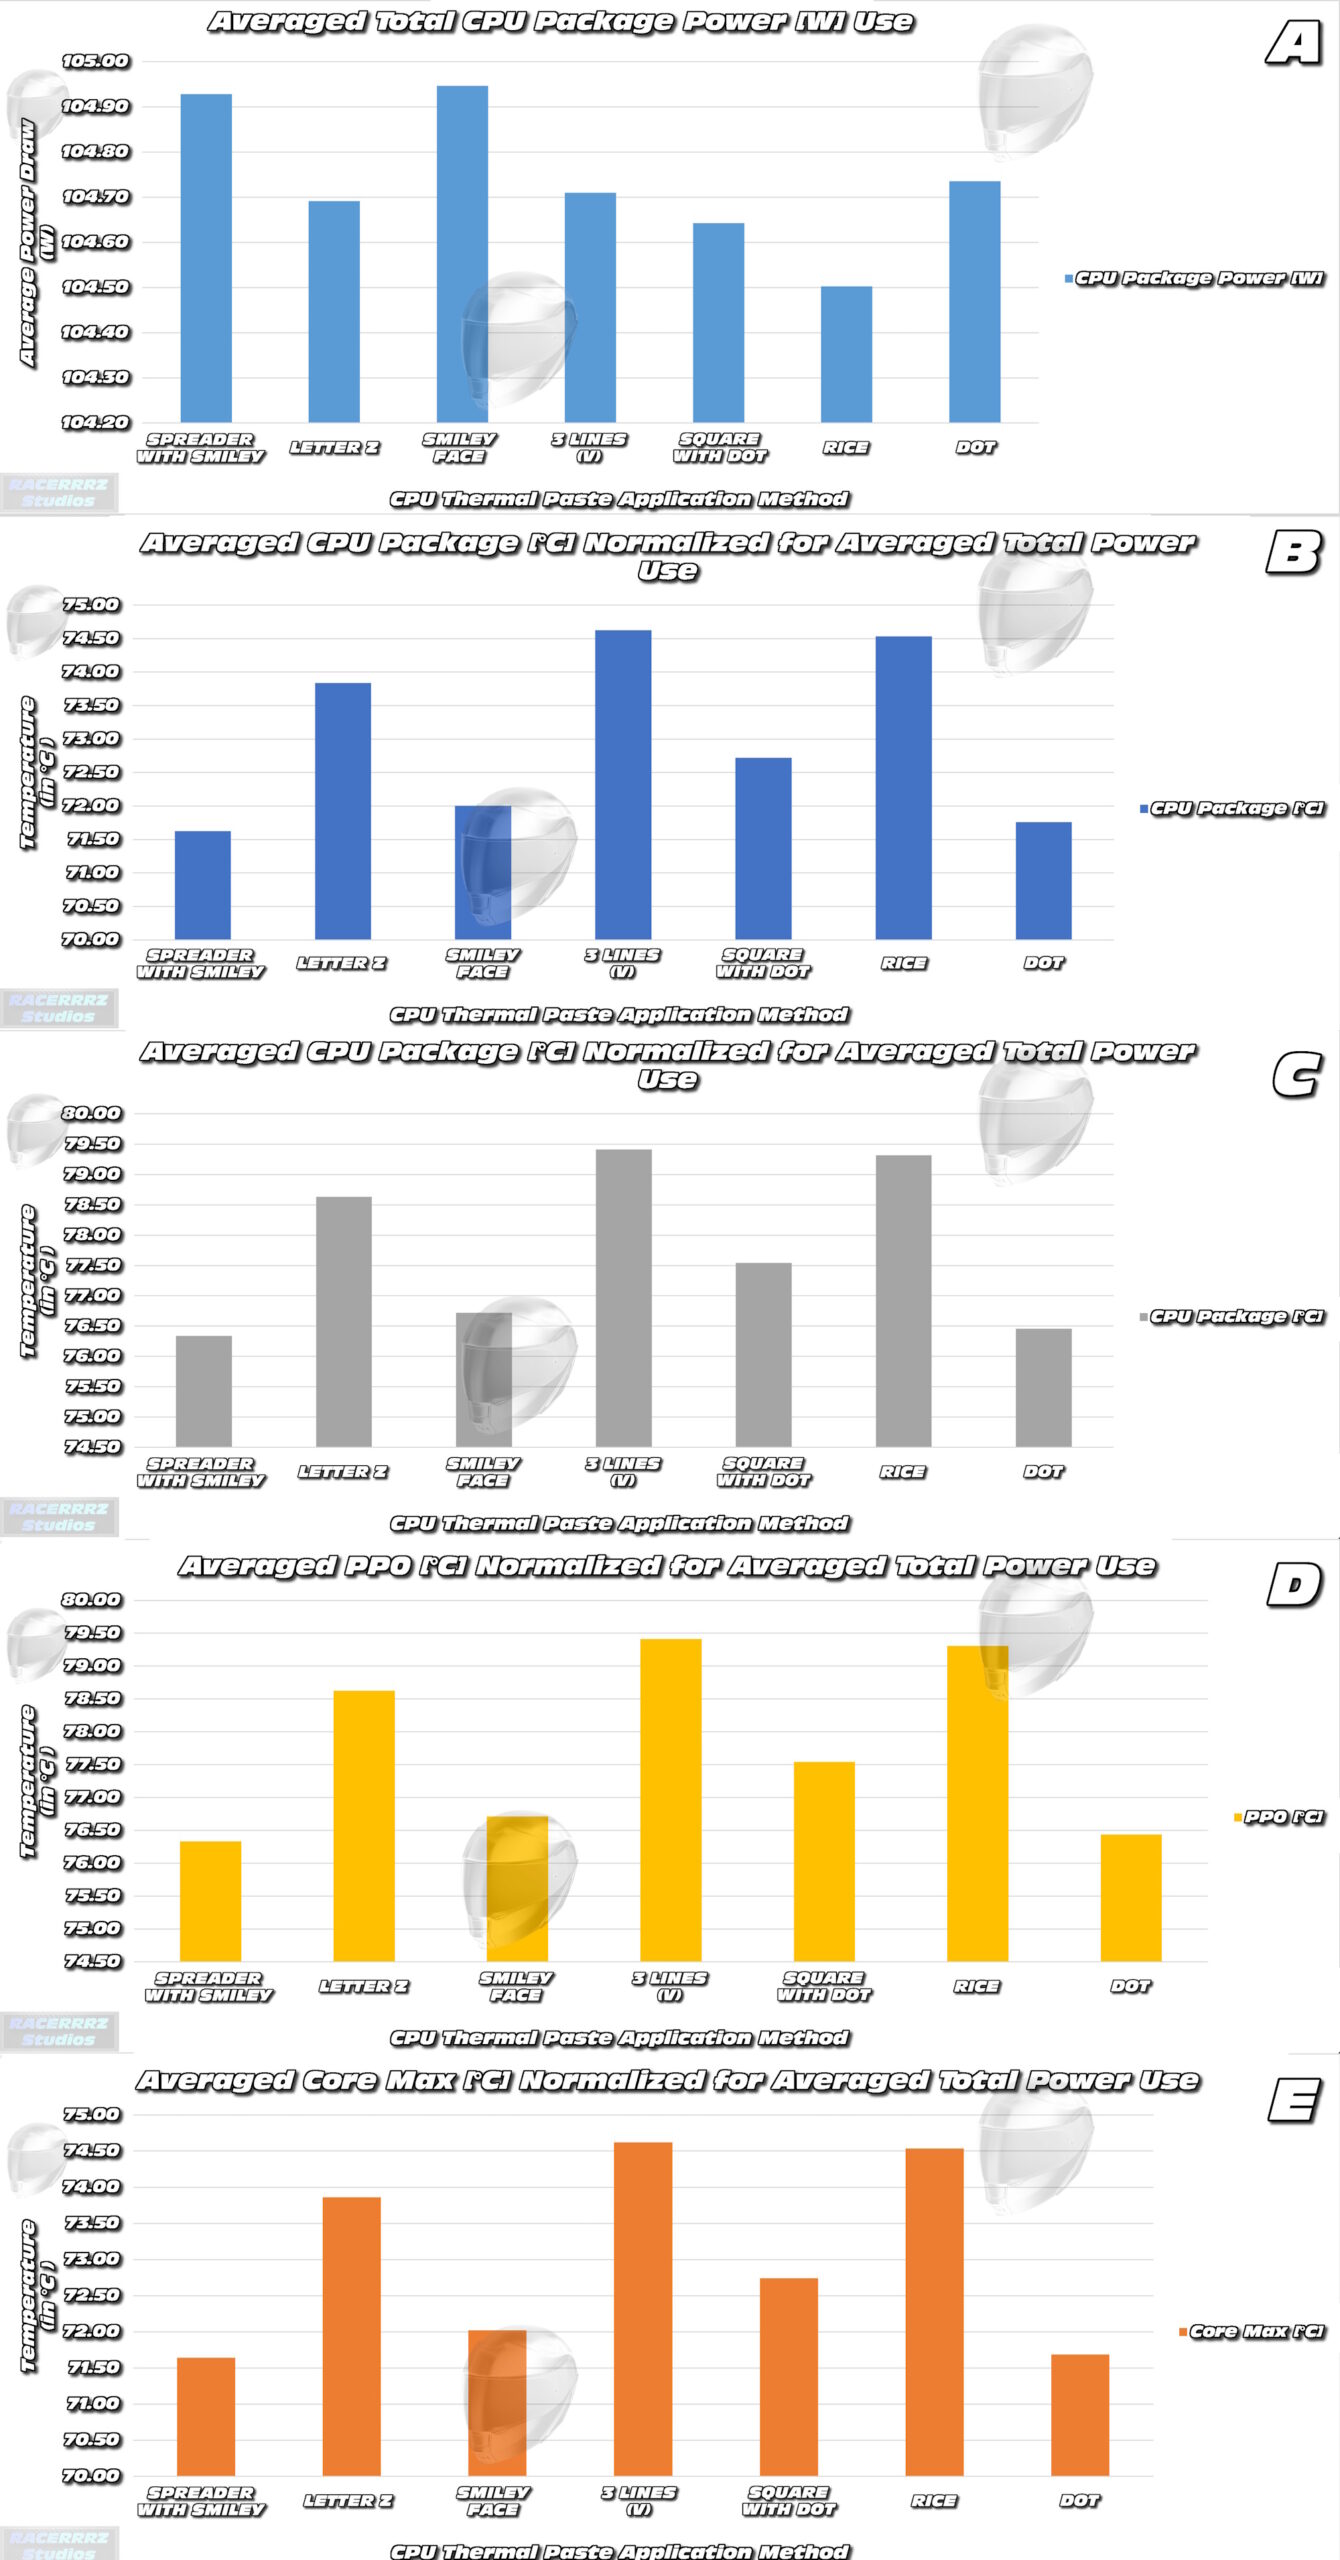
Thermal Testing Data:
Main Results of CineBench R23 10 Minute Multi-Core run.
Panel A) CPU total averaged power use during the 10min CineBench R23 runs were different between test conditions. The differences were small and may not reach statistical significance but are interesting none-the-less. This data was used to normalize all other data to account for the impact that power draw differences may have had between test runs. The underlying reason for why methods like Spreader with Smiley or Smiley Face used slightly more power may relate to better cooling efficiency.
Panel B and C) HWiNFO reported two thermal readings for CPU Package on the Z440 – presumably with different calculation methods. Both were included for comparison (Panel B and Panel C). Spreader with Smiley Face, Smiley Face and Dot Method recorded the lowest normalized average CPU package temperatures.
Panel D) PP0 [C°] demonstrates the temperature of the core of the CPU – with reference to the power junction for the CPU cores. This should be the hottest point of the CPU under normal conditions. Spreader with Smiley Face, Smiley Face and Dot Method reported the lowest PP0 [C°] temperatures for the 10min CineBench R23 runs, suggesting the most efficiency cooling of the core operations of the CPU.
Panel E) Averaged Max Core temperatures reported during the CineBench R23 runs. Spreader with Smiley Face, Smiley Face and Dot Method reported the lowest Max Core temperatures which suggests the best cooling efficiency of the entire IHS surface.

Thermal Testing Data:
Main Results of CineBench R23 10 Minute Multi-Core run.
Panel A) RICE Method completed the CineBench R23 run in over 20minutes due to failing to complete one full render in 10 minutes. Rice Method had a very quick CPU temperature ramp rate during test start and settled with a stable output of data readings for the entirety of the benching. The midpoint drop was from the benchmark restarting the render.
Panel B) DOT Method completed the CineBench R23 run in 10 minutes. There was a steady temperature ramp rate at the start of the test and all readings held a relatively stable peak.
Panel C) Three Lines Method completed the CineBench R23 run in 10 minutes. There was a steady temperature ramp rate at the start of the test, but appeared to get to peak temperatures quicker than other methods, and all readings held a relatively stable peak.
Panel D) The Letter Z Method completed the CineBench R23 run in over 20minutes due to failing to complete one full render in 10 minutes. The Letter Z Method had a slower CPU temperature ramp rate relative to the Rice method (which also took 20 minutes) during test start, and settled with a stable output of data readings for the entirety of the benching. The midpoint drop was from the benchmark restarting the render.
Panel E) Smiley Face Method completed the CineBench R23 run in 10 minutes. There was a steady temperature ramp rate at the start of the test, but it appeared slower to get to peak temperatures than other methods, and all readings held a relatively stable peak.
Panel F) Square with DOT Method completed the CineBench R23 run in 10 minutes. There was a steady temperature ramp rate at the start of the test, and it appeared similar to Smiley Face Method for ramp rate to get to peak temperatures, and all readings held a relatively stable peak.
Panel G) Spreader with Smiley Face Method completed the CineBench R23 run in 10 minutes. There was a steady temperature ramp rate at the start of the test, but it appeared slightly quicker to get to peak temperatures compared with Square with DOT or Smiley Method, and all readings held a relatively stable peak.